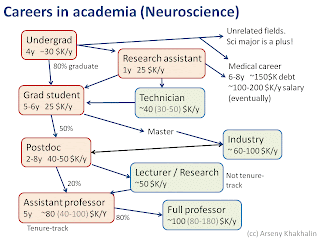
I created this slide for my summer students (high school kids), to give them an understanding of what one may expect from a career in academic neuroscience.
Red shapes are temporary, blue are permanent. All numbers are specific for the neuroscience field, and are based on some statistics for about last 5 years that I managed to google out. I show average years spent in each position, average salaries (this data mainly comes from glassdoor.com), and average chances to get to the next level (statistics from opinion pieces about bleak perspectives of recent PhDs).
Also see some discussion here:

